The principle aim of the project being undertaken in collaboration with GO Plc. is to automate the deployment of various network services using the NETCONF protocol and the YANG data modelling language. Network automation is set to play an important role in the development of computing within the next few years, particularly in the area of telecommunications and Internet Service Providers. This is because automation saves time through reducing human interaction and removes the possibility of human error.
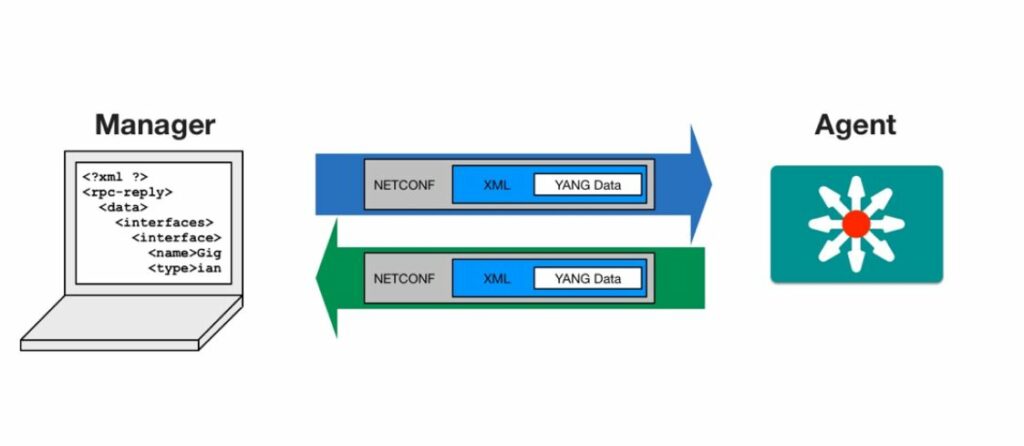
At the moment, the most common method for network management is a combination of using the Simple Network Management Protocol (SNMP) for monitoring the network state and using a Command Line Interface in order to affect any configuration changes on the network devices. Most network vendors limited the amount of configuration that could be done via SNMP and opted to use proprietary interfaces for configuration. NETCONF helps solve this issue as it is a standardized network management protocol which allows configuration changes to be made to network devices through Remote Procedure Calls. The protocol can be used in the same way on devices made by different vendors as long as a NETCONF agent is running on the device.
For the implementation of the project, GNS3, a network simulation tool, was run in a Ubuntu 20.04 environment to emulate a variety of possible network services together with the respective router configurations. More specifically, the project was focused on the automatic provisioning and deprovisioning of an E-Line connection, which is defined by the Metro Ethernet Forum as a point-to-point link between two network interfaces where both ends can only communication with each other. The network service is then monitored to ensure that it is in a healthy state.
Furthermore, a basic network inventory and service catalogue was developed using a MariaDB database.

Student: Kyle Fearne
Course: B.Sc. (Hons.) Computer Engineering
Supervisor: Prof. Saviour Zammit