Property sales in Malta throughout the COVID-19 pandemic, topped €3 billion in 2020, surpassing 2019 figures [1]. Despite this rise in property sales, interviews with local real estate executives revealed that the absolute majority of real estate agencies in Malta still valued property listings manually, without the help of any machine learning technologies. It also emerged that the value of a property would be heavily influenced by its location, and taking into account the amenities within the immediate surroundings of the property. This study set out to explore the influence of amenities on property valuation by exploring whether predictive accuracy would improve when considering proximal amenities.
Real estate data for the period 2015 to 2020 was sourced from a local real estate agency. Records containing blank values, location outliers and property types in limited supply (such as farmhouses) were removed. Prices were adjusted to mitigate the effect of price increases over the period. An online map service was utilised to obtain latitude-and-longitude values for all property listings (geocoding), as well as to extract amenities around the Maltese Islands and their respective coordinates. Four categories of amenities were considered, namely: bus stops, shops, natural features and sundry amenities (including, restaurants, bars and cafés).
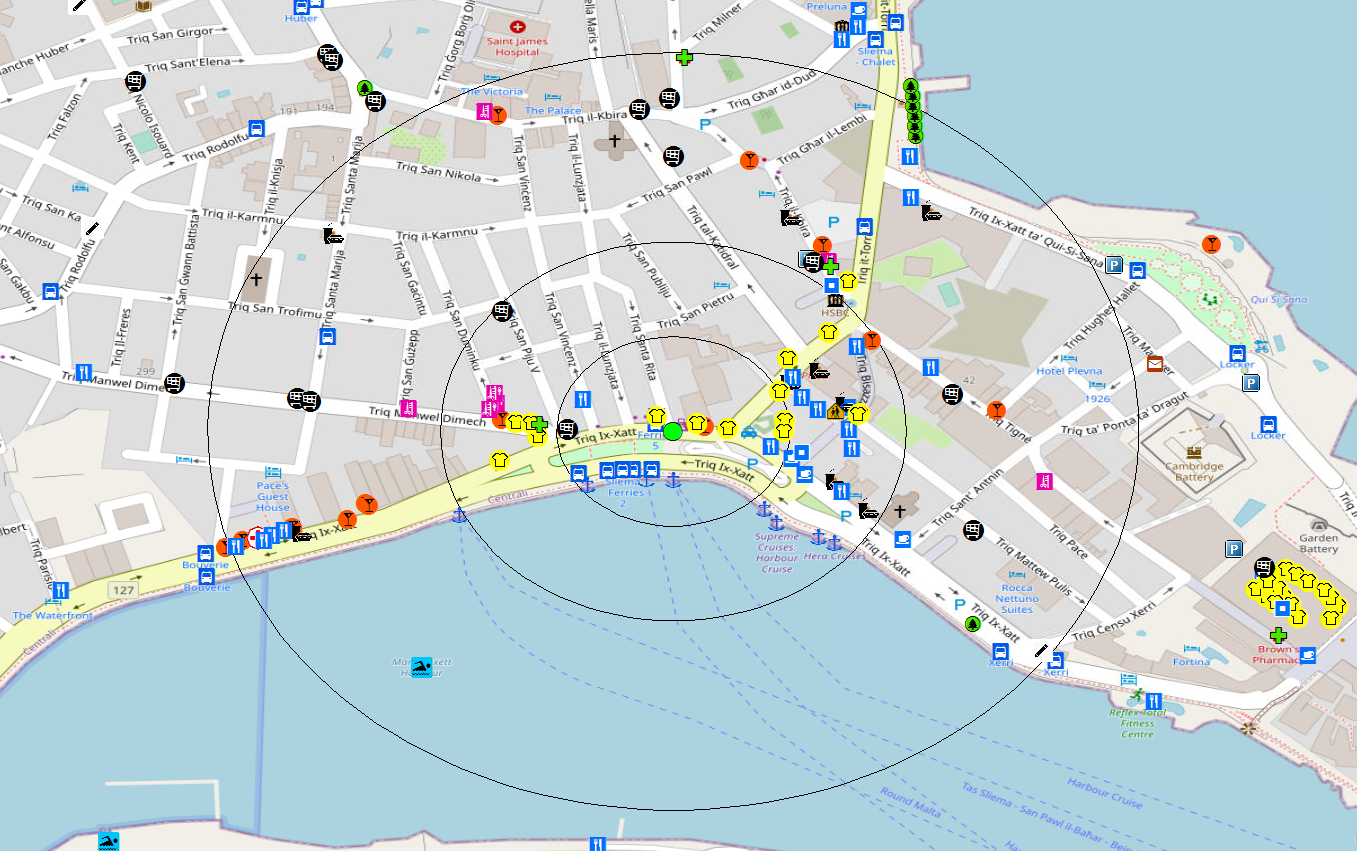
A tier system (see Figure 1) was used where, for each listing, the quantities of amenities falling within each of the proximity thresholds ‒ 100m, 200m and 400m ‒ were stored. Two types of predictive models were developed. These are: multi-layer perceptron (MLP) neural networks and multiple linear regression (MLR) models, through which a number of model configurations considering property data with no amenities, individual groups of amenities or all amenities were created.
The performance of the models was determined by considering the mean absolute percentage error (MAPE) produced, a measure which considers the error between actual and expected price. The baseline model that considered solely property-specific data – such as property type, locality, number of bedrooms, bathrooms and square area – registered a 19.21% MAPE with a mean absolute error (MAE) of €90,837.47. On the other hand, the best-performing model, which considered a number of amenities at different proximity measures, scored an 11.69% MAPE with an MAE of €45,637.78.
Therefore, since the MAPE decreased by 7.52% and MAE decreased by around 50% when considering proximal amenities, this might suggest that the consideration of proximal amenities could contribute towards a more accurate prediction. On the contrary, it was observed that the less attributes the MLR models were given, the better the models tended to fare ‒ with the base model performing best of all, with a 22.81% MAPE. Furthermore, the results suggest that the MLP models generally performed better than the MLR models. This is further supported by an 11% difference in MAPE between the best performing MLP model and the best performing MLR model.
References/Bibliography
[1] Malta Developers Association, “Property industry delivers €3 billion in sales in Covid year.”, mda.com.mt, 2021. [Online]. Available: https://mda.com.mt/property-industry-delivers-e3-billion-in-sales-in-covid-year/. [Accessed: 01- May- 2021].
Course: B.Sc. IT (Hons.) Computing and Business
Supervisor: Dr Michel Camilleri