This research applies data mining techniques to the ‘Mapping Police Violence’ dataset, which provides information on every individual killed by police in the USA since 2013. Knowledge related to police violence is extracted by profiling typical violence victims, analysing violence across different states, and predicting the trend such incidents follow.
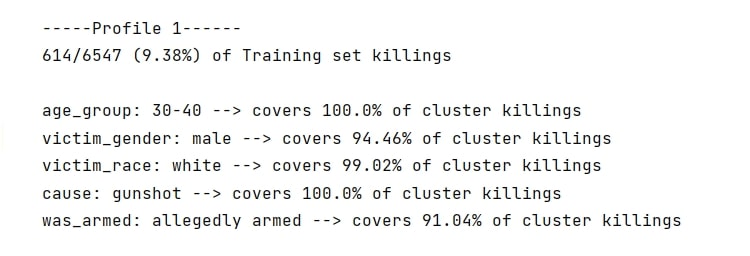
The first task in this study involved profiling the victims, which was tackled by clustering the data and identifying the main types of reports. The typical victim belonging to each cluster set was then extracted. This was done using different clustering algorithms, namely: k-means, k-medoids, and self-organising maps.. The generated profiles were validated by observing how many killings in the dataset are accurately described by the different profiles.
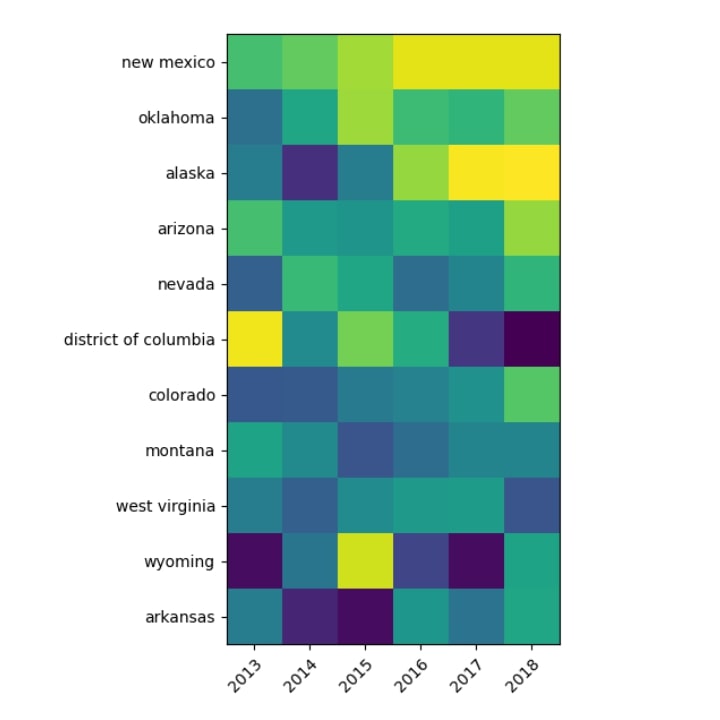
The second task was to cluster the data in each location separately. This helped establish the most common locations where such incidents took place, and the typical victim profiles within those locations.
Using regression techniques, a prediction of the number of future police killings was attempted, based on information related to past incidents, anticipating the third task of this study. This entailed considering information such as the unemployment rate in each state to establish whether including such external information would be helpful in accurately predicting the number of killings. The results were evaluated by comparing the predicted number to the actual number of killings that took place.
This research could be extended by employing hierarchical clustering, thus allowing a more detailed examination of the generated profiles. Additionally, it would be possible to perform clustering by focusing on the years in which the killings took place, so as to follow how the profiles generated change throughout the years. The analyses performed in this study could also be applied to datasets that focus more on general police interactions ‒ such as stop-and-search data ‒ and observing whether there might be any similarities between analyses of the different sets of data.
Course: B.Sc. IT (Hons.) Artificial Intelligence
Supervisor: Dr Joel Azzopardi
Co-supervisor: Mr Nicholas Mamo