This work tries to understand what can be done to try and reduce traffic jams in Malta. It
looks into a new method of tackling this issue by utilizing the currently available technology
for traffic mitigation. The project tries to look into how IoT devices and other Intelligent
Methods can be integrated in roads to create a dashboard that can give information to
commuters.
The central part of this project looked into using different APIs to gather the information
necessary for displaying on a dashboard. The advantage of using APIs is that they can
provide constant real-time information. In addition, this data is readily available. It does not
require any infrastructure to be built since the API providers are gathering information. As a
result, this would be implemented in countries such as Malta, where there are very few IoT
devices built into the roads. Two APIs were used for the artefact. The first API was the
Distance Matrix API, powered by the Google Maps Platform. By giving an origin and a
destination, this API can provide two instrumental pieces of information. These are the
duration, and the duration in traffic. The time is given both in minutes and in seconds. By
subtracting the duration from the duration in traffic, the actual time spent in traffic in
seconds can be obtained. Therefore, the level of congestion in that area can be calculated
by using the actual number of seconds spent in traffic. Then by using a simple conditional
statement, the level of congestion (light congestion, medium congestion, heavy congestion)
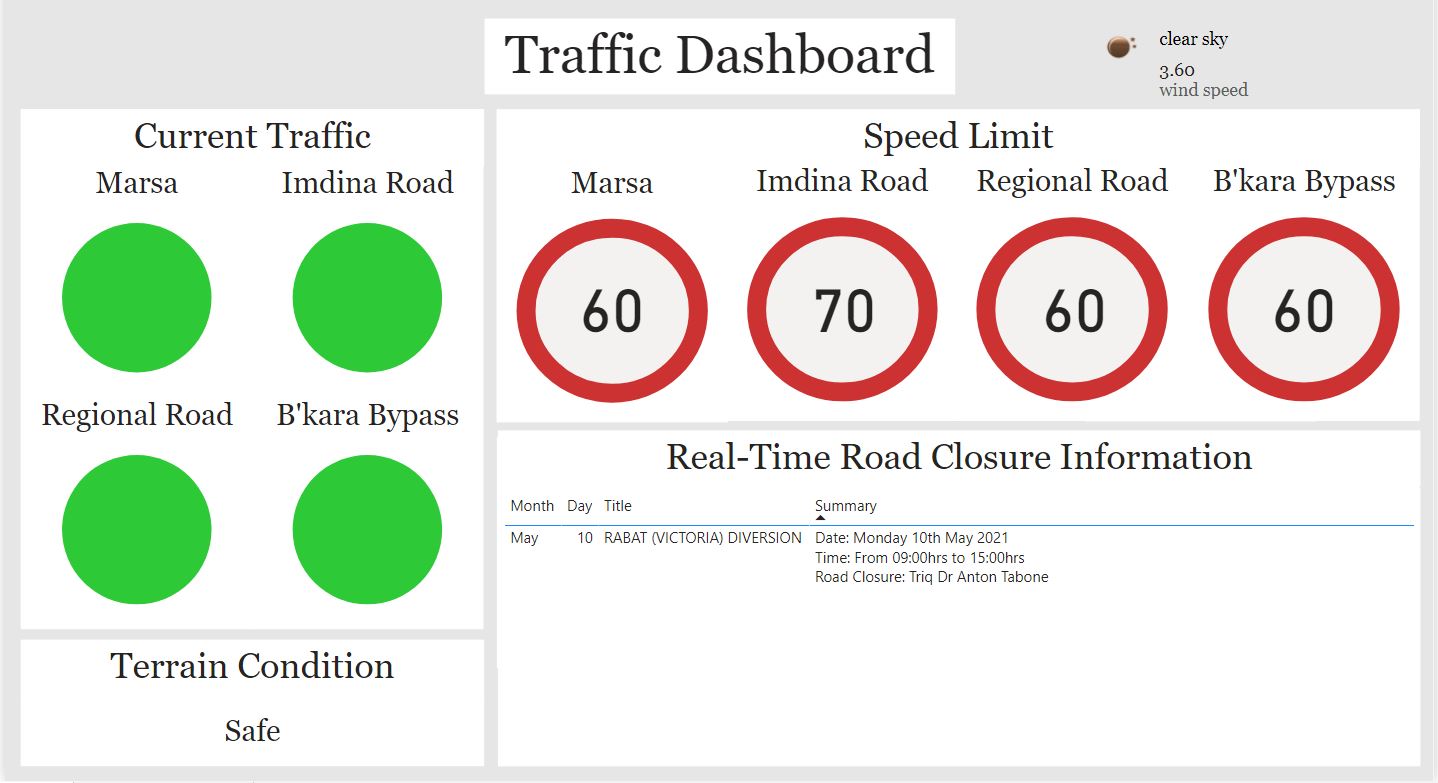
can be calculated. The weather API provided by OpenWeather was also used. This API was
vital as it could display information such as weather conditions. This API was also used to
detect the terrain condition based on the weather. Another reason why this API was used
was so that a recommended speed limit could be displayed on the dashboard based on the
weather condition. If, for example, it is raining, a lower speed limit is shown.
The second part of the project focused on the results obtained from the questionnaire.
Many functions that users feel necessary for displaying on a dashboard require IoT devices to be put into road networks. Therefore, possible IoT technologies were suggested for
obtaining such data. By implementing the proposed IoT devices, real-time data such as
parking space availability could be obtained. From this data, the dashboard could be
updated to show this information. Early results from the questionnaire showed that people
wanted to see alternative routes on these dashboards with parking availability coming in
second.
The main limitation for such a project is the lack of available IoT devices that can give the
necessary data for these dashboards. By investing in these technologies, more data can be obtained to make the dashboard more useful.
Course: B.Sc. IT (Hons.) Computing and Business
Supervisor: Dr Lalit Garg