Climate change has become a growing problem globally, and the analysis of datasets to identify patterns and anomalous behaviour with regard to the climate is more crucial than ever. However, analysing such datasets could prove to be overwhelming, as these datasets tend to be too large to inspect manually. As a result, the need has arisen for techniques to efficiently scour and manipulate such extensive data. These are generally referred to as data-mining techniques.
The research for this project involved using different data-mining algorithms to extract anomalies and teleconnections from a dataset of monthly global air temperatures, covering a period of 72 years (1948-2020).
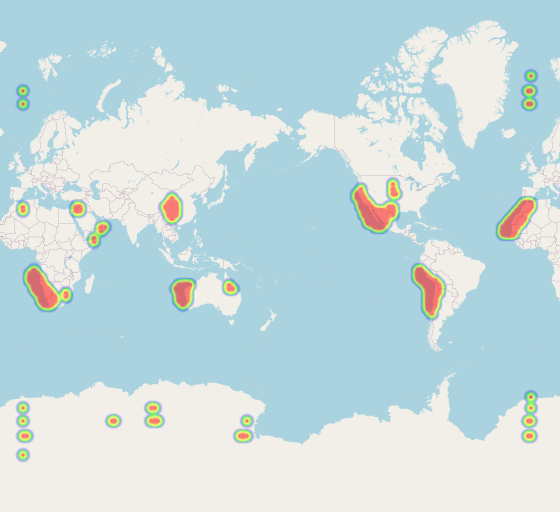
Anomaly detection is a significant step in data mining, and is primarily concerned with identifying data points that deviate from the remainder of the data, and hence are considered anomalies. The purpose of anomaly detection in climate data is to identify any spatial (across space), temporal (across time) or spatial-temporal (across both space and time) anomalies within the dataset. They are crucial in understanding and forecasting the nature of the ecosystem model of planet Earth. The anomalies are detected using three algorithms, namely: k-nearest neighbors (k-NN), k-means clustering, and density-based spatial clustering of applications with noise (DBSCAN).
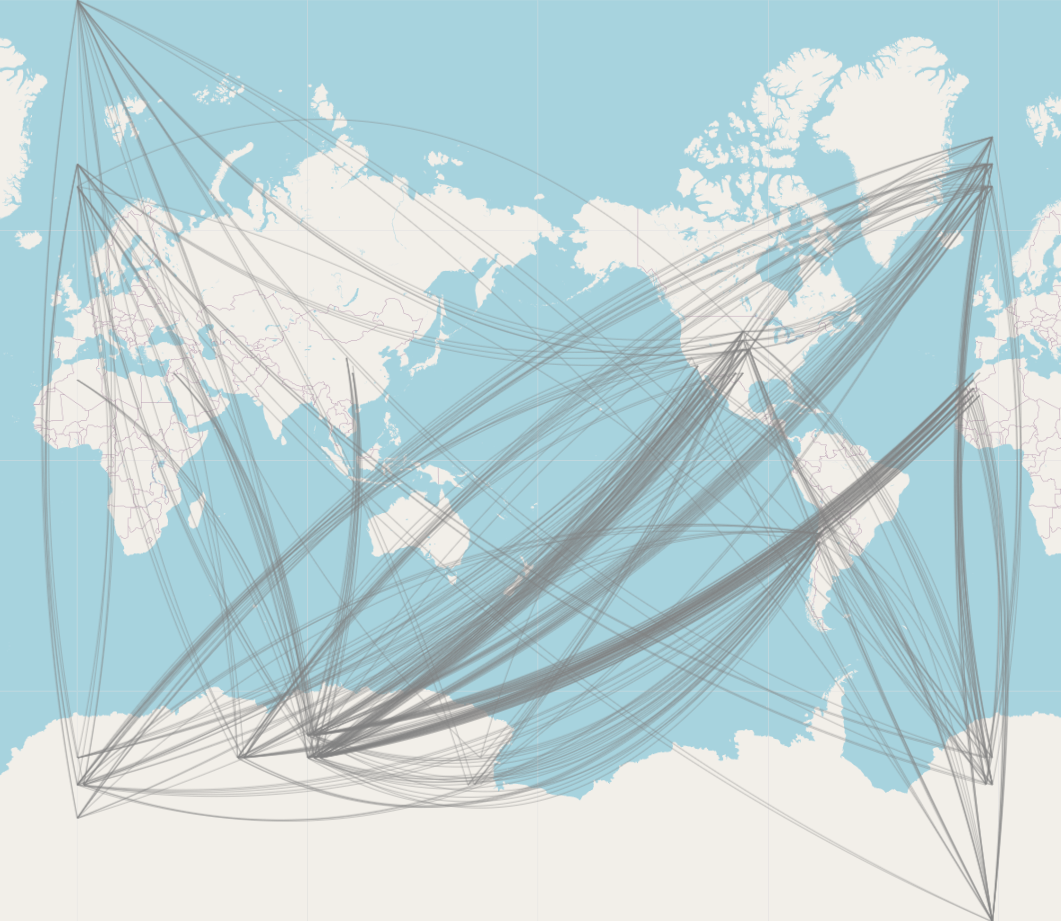
Teleconnections are recurring and persistent patterns in climate anomalies, and connect two distant regions to each other. Their significance is due to the fact that they reflect large-scale changes in the atmosphere and influence temperature, rainfall, and storms over extensive areas. As a result, teleconnections are often the culprits in the event of anomalous weather patterns occurring concurrently over widespread distances. The teleconnections are detected using three association-mining techniques ‒ Apriori, FP-growth, and Generalized Sequential Pattern (GSP) ‒ over the spatial-temporal anomalies identified previously.
The extracted anomalies and teleconnections, as obtained from the previously mentioned algorithms, have been represented in interactive graphs and heat maps.
Course: B.Sc. IT (Hons.) Artificial Intelligence
Supervisor: Dr Joel Azzopardi