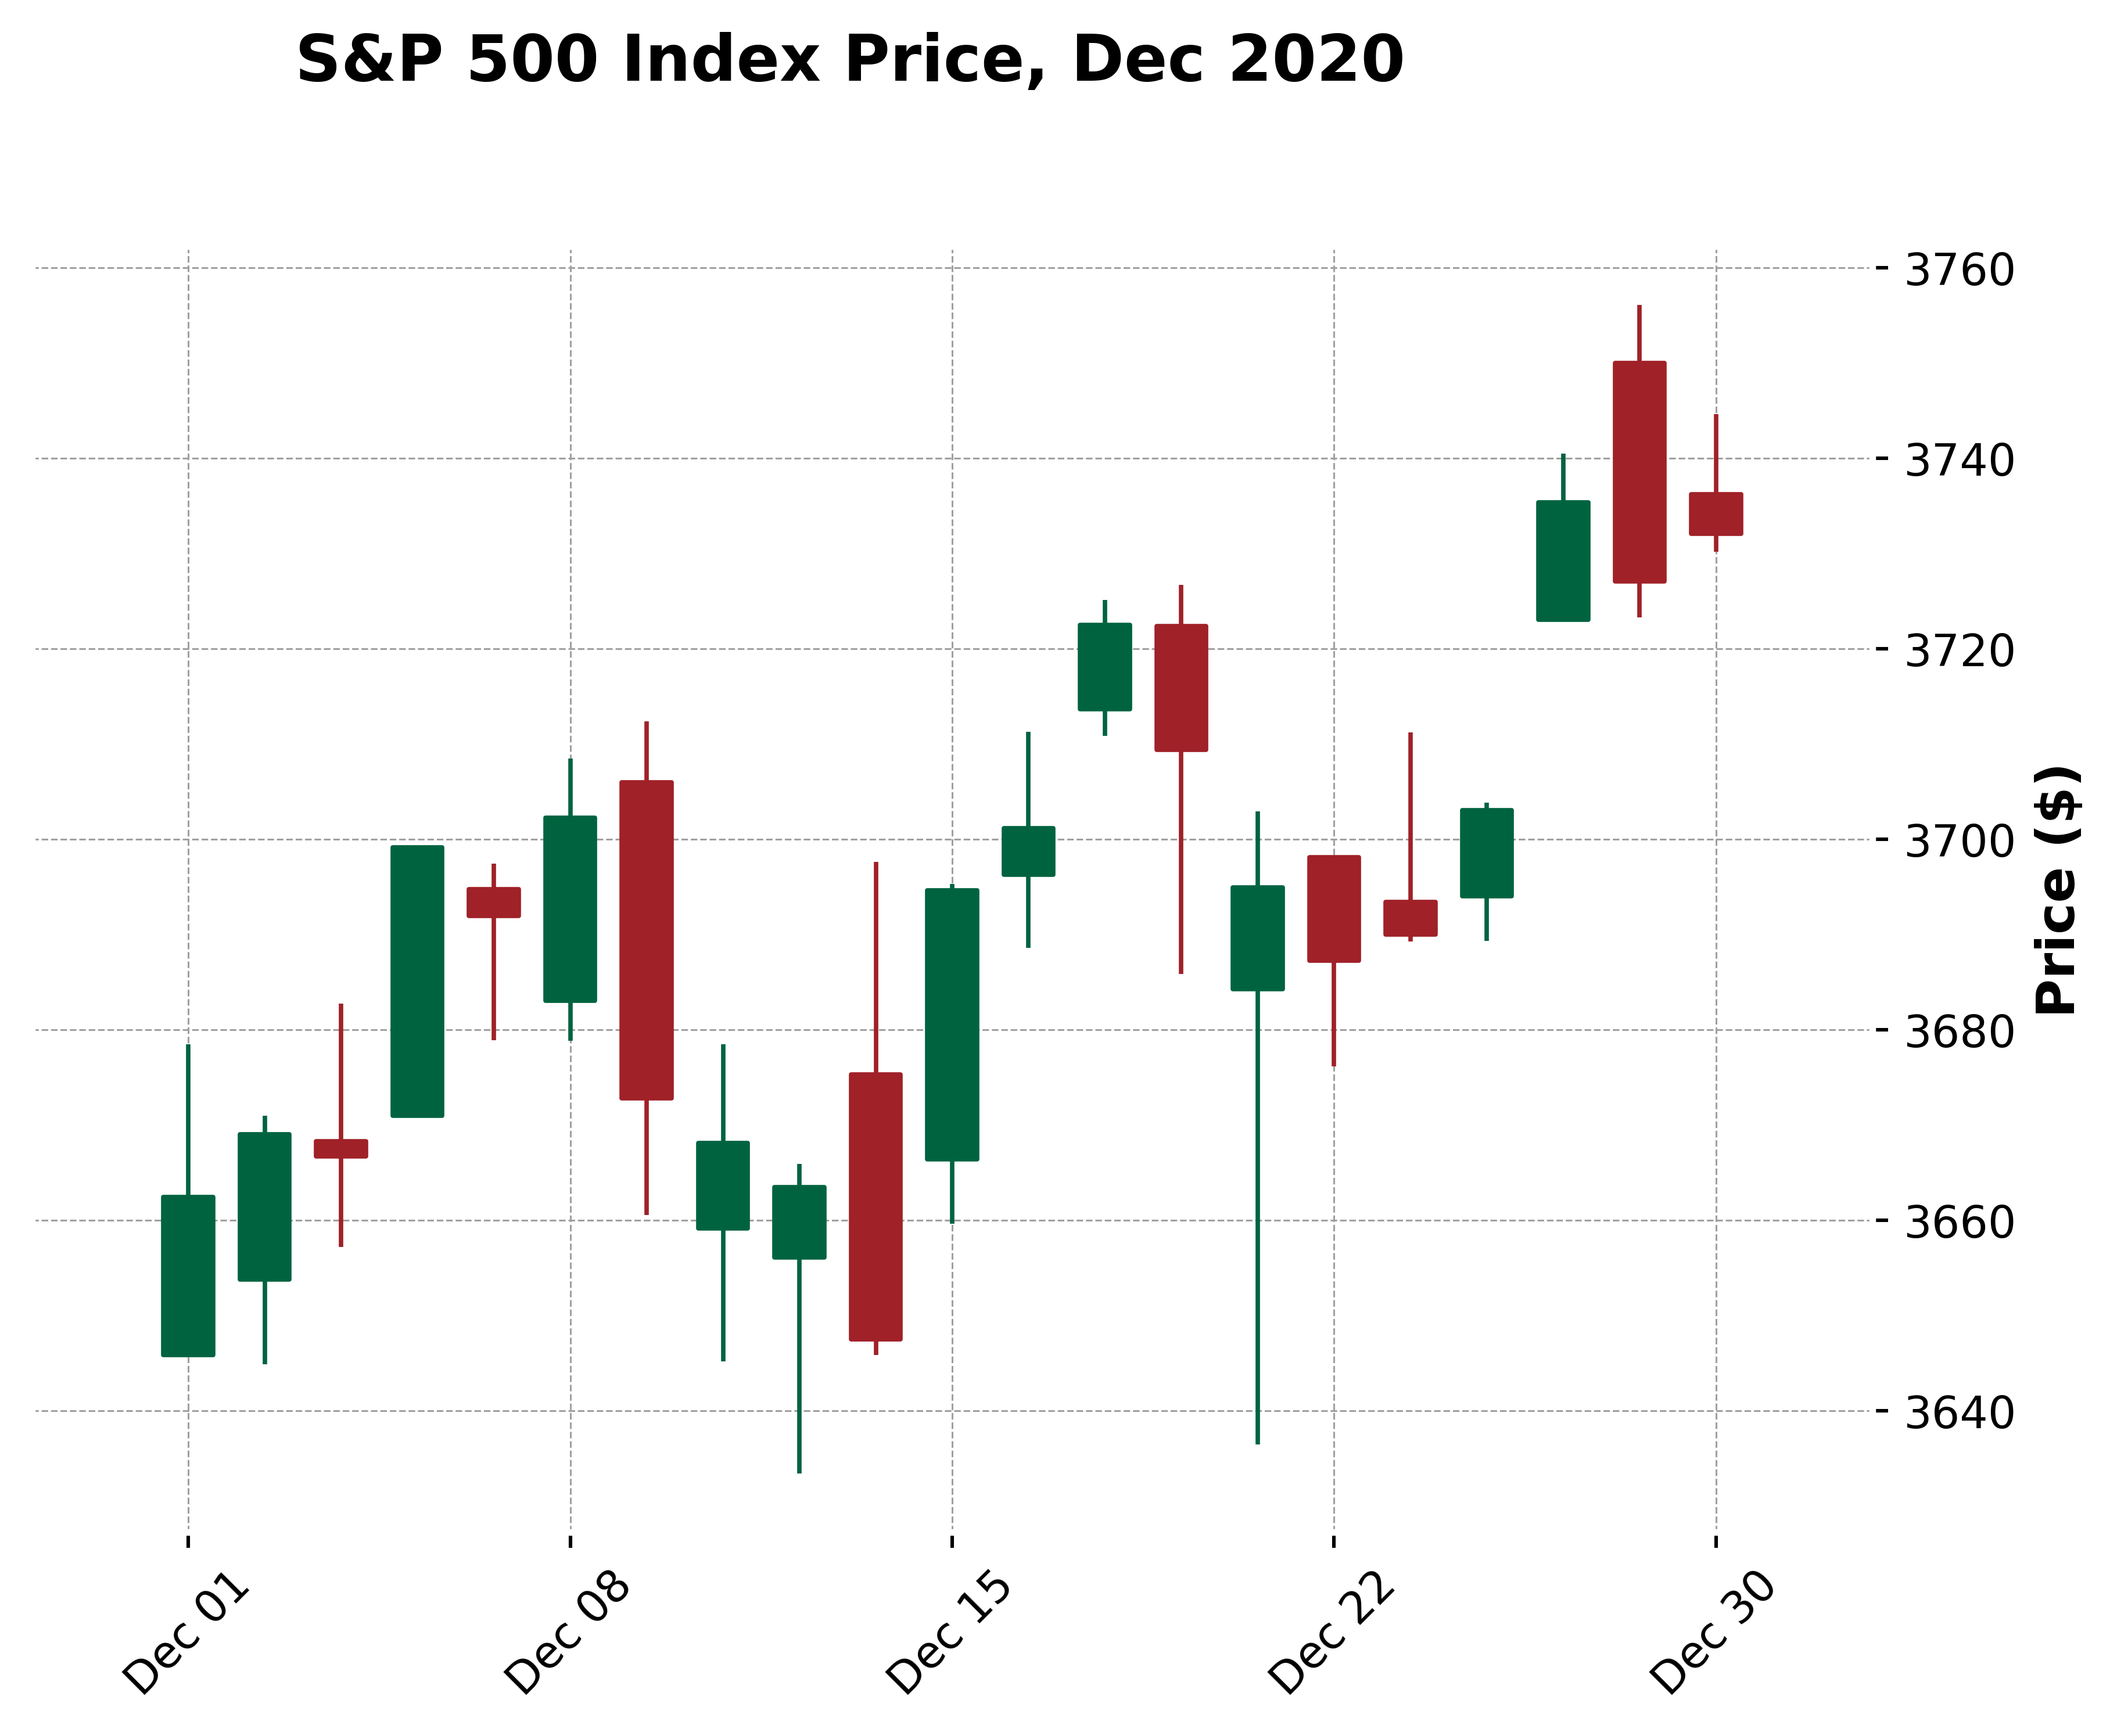
The buying and selling of financial instruments, such as stocks and bonds, has for long been an essential activity in maximising investors’ wealth. Stock markets, one of which being the New York Stock Exchange have facilitated this trading activity. A pertinent question in this field is to determine whether particular securities would increase or decrease in value in the foreseeable future. Changes in value for an equity could be described through a candlestick chart, as per Figure 1.
In financial trading, an approach that has recently gained traction is algorithmic trading, which is the buying and selling of (financial) instruments by using algorithms. This was possible through the exponential improvements in computational speed, along with the introduction of diverse machine learning (ML) algorithms. This study exploits ML to predict the general price direction of securities for the three days following each day in the dataset range. This is referred to as time series forecasting.
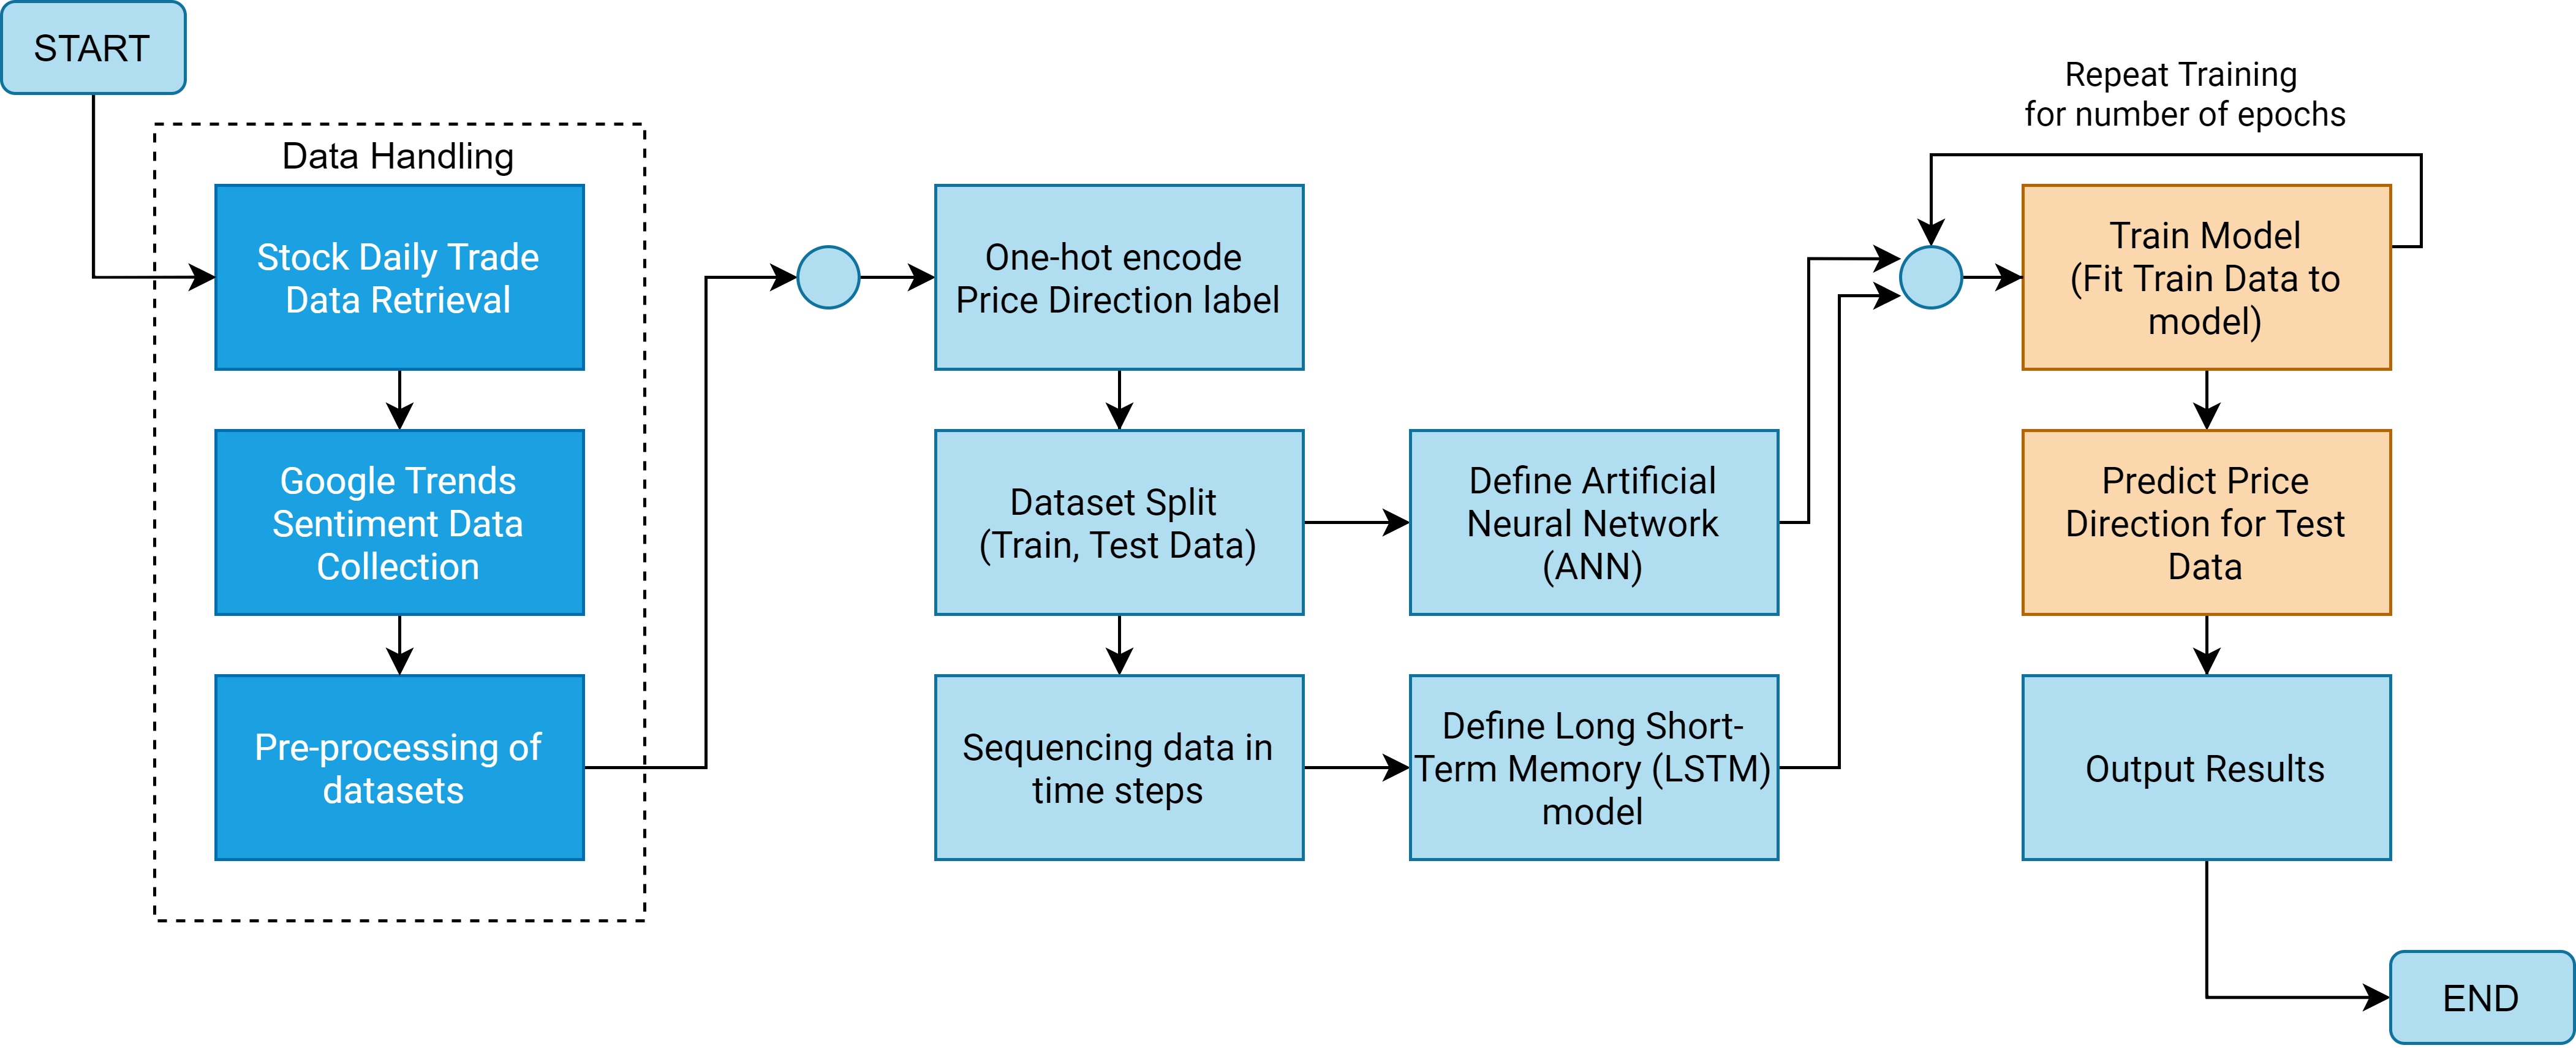
The solution being proposed uses data for stocks domiciled in the United States found in the S&P500 index, which is an indicator representative of the largest 500 US-listed companies. Two stocks per S&P500 sector were reviewed with the purpose of obtaining a fair representation of the US market. A baseline artificial neural network (ANN) model, and a long short-term memory (LSTM) model were used in parallel, as described in Figure 2. The latter model has recently become popular in time-series problems in view of its ability to remember the previous outcome of neurons.
The COVID-19 pandemic has affected businesses in a global manner. Hence, this work also attempts to identify whether there is value to be derived from the sentiment towards the pandemic, in terms of prediction accuracy. Google Trends data involving pandemic-related terminology was used to derive additional features to be used within an LSTM model, providing an effective comparison between the model implementations in this study.
Course: B.Sc. IT (Hons.) Computing and Business
Supervisor: Prof. John M. Abela