Outcome forecasting in football is complex, due to the unpredictability of how various factors (e.g., team form, player consistency, and social influences) interact with each other. Data science provides insight for such uncertainties through artificial intelligence (AI) statistics, mathematics and exploits domain knowledge to create accurate models.
This project makes use of a modified Elo rating system to measure team strength during a season, and Monte Carlo simulations (MCSs) to predict fixture outcomes, as seen in Figure 1. The Elo rating system was originally developed to measure the performance, consistency, skill, and quality of chess players. Its effectiveness and ranking reliability made it equally applicable to football.
Probability distributions based on the Elo rating system could be identified from publicly available football datasets. The MCSs rely on these distributions to predict the outcome of each tournament fixture and the end-of-season ranks. In this work, MCSs played the season tournament for a predetermined number of rounds, at the end of which the result was the predicted ranking of the teams.
The predicted results of the season were then compared to the actual league positions for multiple leagues in European football. These predicted league standings matched the majority of the top-, mid-, and bottom-table teams of such leagues when compared to the actual season results, with only few deviations from the actual order being noted. This is an expected outcome, due to the probabilistic nature of the problem, which makes predicting the exact sequence difficult to achieve.
This research showed that the Elo rating system is a reliable measure of team strength, and is important in the prediction of the end-of-season standings. The predictive accuracy, measured in average rank probability score was 0.19, as seen in Figure 2. This is a similar score to that achieved by other studies, which scored between 0.19 and 0.21.
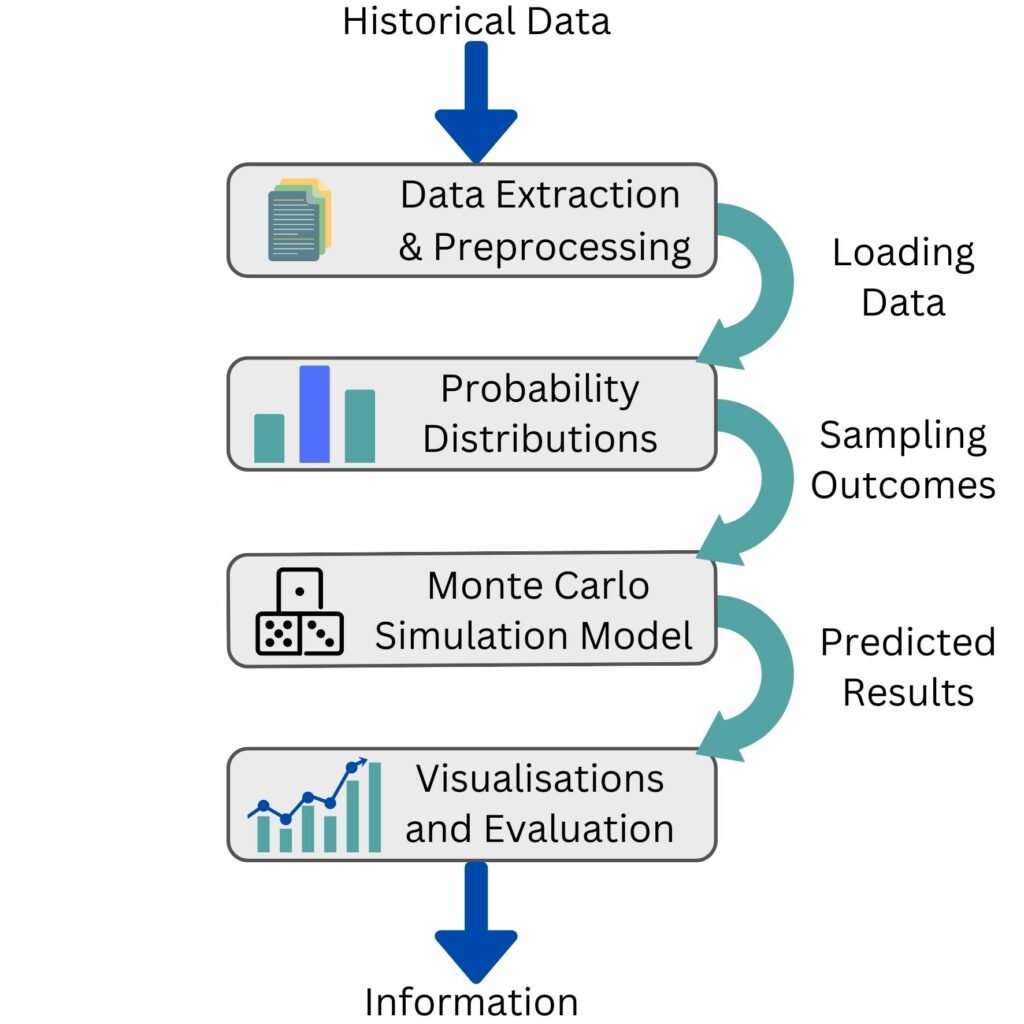
Figure 1. Overview of the system

Figure 2. Rank probability score for each simulated match
Student: Steve Galea
Supervisor : Steve Galea