This project consisted in creating a system that would be able to flag unusual actions by players in real datasets. This system could be applied to many areas, one of which being fraud detection in gaming.
An anonymised dataset from a gambling company was used for this research. The system grouped together the players’ actions, creating a visual representation in the form of a graph. This graph would allow the system to detect patterns in player behaviour. Using a group [1] of existing artificial intelligence (AI) models, the system could identify unusual or anomalous patterns of behaviour, and flag them as potential fraud or other suspicious activities.
The results would be displayed to the user through an easy-to-understand interface. The user could interact with the system to see more details about specific parts of the graph and understand why they have been flagged as anomalous. For example, if a player has been repeatedly trying to use blocked cards, this could indicate fraudulent behaviour, and the system would flag this activity as anomalous.
This project sought to improve existing anomaly-detection algorithms by incorporating graph-based techniques. Graphs are particularly helpful because they can represent complex relationships between data points in a way that would be easy to understand. Moreover, by analysing the connections between players’ actions in the graph, the system could identify patterns and flag suspicious behaviour more efficiently.
One challenge of developing an anomaly-detection system is making sure that it would identify unusual behaviour accurately and without raising too many false positives. False positives tend to cause a waste of time and resources, and may cause users to lose faith in the system’s accuracy.
The proposed system was evaluated against three main criteria: accuracy, speed, and insight. The accuracy metric compared the system’s results to pre-labelled data to determine how well it detected anomalies. The speed metric measured the length of time taken for the system to run, and the insight metric assessed the adequacy of the system’s explanation for flagging certain activities as anomalous.
In summary, this research seeks to improve existing anomaly detection algorithms by using graph-based techniques to identify unusual behaviour in datasets. By creating a visual representation of player actions in the form of a graph and using a combination of algorithms, the system could identify patterns and flag suspicious activity. The system’s results would be shown to the user through an easy-to-understand interface that would explain why certain activities have been flagged.
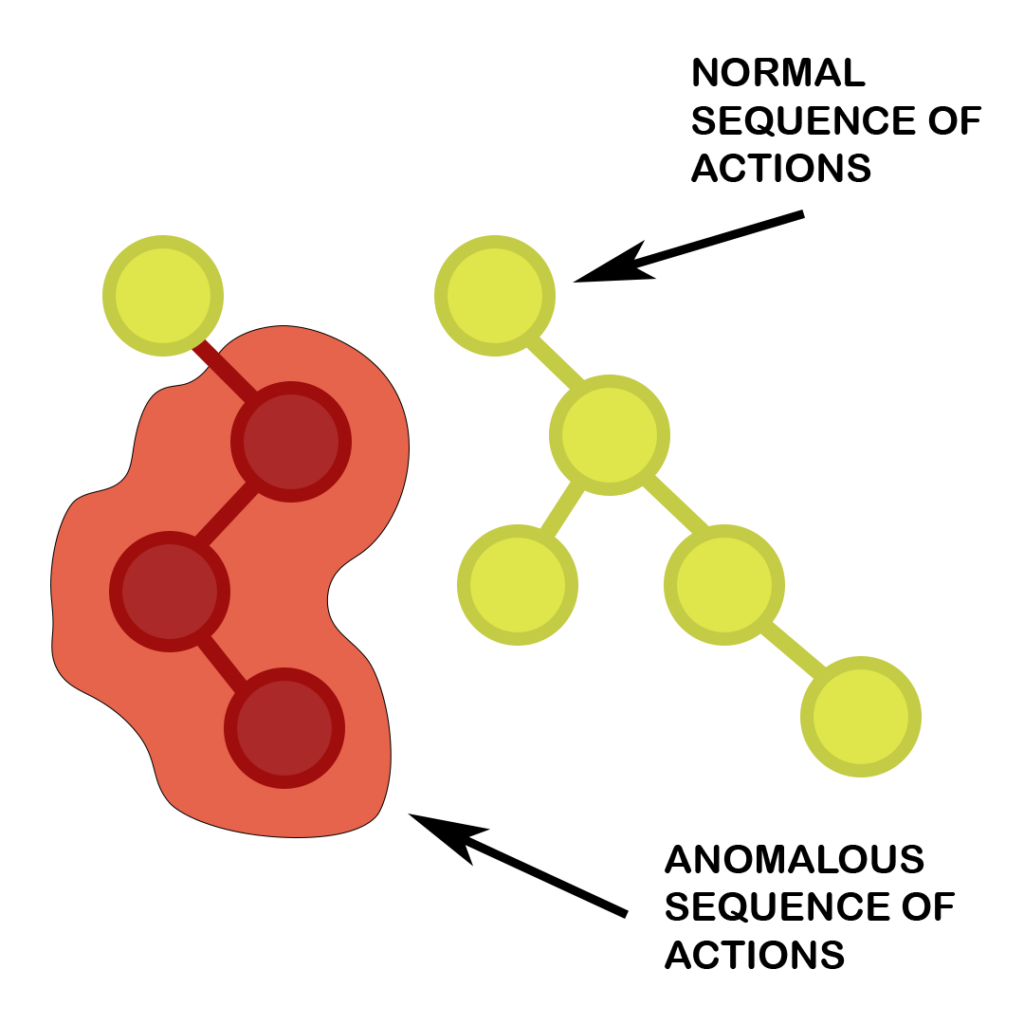
Figure 1. Example of anomalous actions
Student: Calvin Micallef
Supervisor : Dr Charlie Abela