Nowadays many people seek to live a healthy lifestyle, which in turn is increasing the awareness for active mobility and its importance to our health. The significance of safe pedestrian mobility is also recognised on a national level, as could be seen through the rise of incentives promoting car-free travel options and restricting motor access to city centres.
While the above-mentioned incentives are undoubtedly an encouraging development, pedestrians still face daily risk of injury from vehicles. This was particularly evident in the first four months of
2022, where a total of 12 road-related fatalities occurred, 5 of which involved pedestrians being struck by a vehicle. Furthermore, due to an exponential rise in vehicles nationwide, the number of vehicles is expected to outnumber the residents. Therefore, development in this field may contribute to better planning and synergy of all road users.
This study focused on the road-traffic injury rate vis-à-vis pedestrians, by investigating collision patterns that could put pedestrians at risk. This was achieved by modelling the road traffic network and other related features, such as: road safety infrastructures, attractions, and
points of interest. The model could then be used for visualisation purposes, and with the application of data analytic techniques to allow for a more comprehensive investigation of the injury trends and their relation to the physical infrastructure. The outcome of this artefact
would in turn contribute to a better understanding of issues and hazards within a road network, as well as serve as a basis for further development.
The model developed for this study would allow viewing the various layers of geospatial data for Malta, with an analysis of point density and time series clustering. The investigation of incidents and related features by means of spatial analysis may shed light on the dependent variables and injury-prone areas from historic data. Another aspect to the work concerns the application of machine learning (ML) techniques to estimate future injury trends from the historic dataset.
A dataset comprising of traffic-related injury data sourced from the Malta Police Force provides an insight into the injury trends between 2014 to 2018. The data required cleaning, grouping and allocation within a database environment, which was then addressed using SQL commands for retrieval. The data tuples were also geocoded to obtain the latitudinal and longitudinal coordinates for visual analysis and placing them in the context of neighbouring features, such as schools, churches, shops.
The ML-based element may be utilised to estimate the potential risk of injury at given locations and times. This requires the adjustment of the data to a time series format to allow for prediction, based on the behaviour patterns of previous years.
The analysis, techniques and technologies applied in the experimentation part of the study could demonstrate how traffic-injury data could assist in the planning and anticipating of hazards in order to safeguard road users. The information derived could also be made available to pedestrians, to be utilised in finding the safest walking route through a user-centred application.
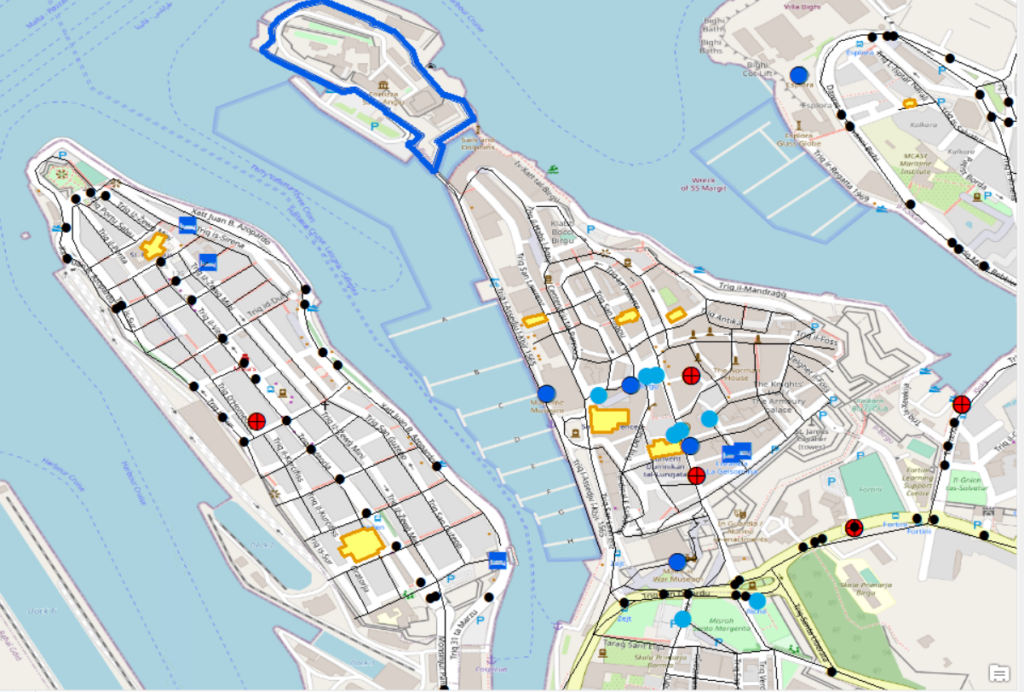
black cross indicate injuries between 01 January and 15 June 2014 in
The Three Cities area. Other attributes: black spots indicate
major/main intersections, light-blue correspond to points of interest,
dark-blue indicates museum points and perimeters, and yellow
indicates church parameters.
Student: Olesya Dmitrievna Borisova
Course: B.Sc. IT (Hons.) Computing and Business
Supervisor: Dr Michel Camilleri