It is becoming evident that hospital admissions and patient length of stay are highly dynamic. Different departments, particularly the emergency ward, may experience long and perpetual queues during certain periods. In such cases, the overall workflow for effectively managing and preparing medical departments’ resources has become a daunting task. Not only that but economists are also bearing heavy concern on the efficient use of scarce resources in hospitals. In
certain countries, this issue is also reaching unsustainable levels endured by the general population [1-2]. This is why a growing need to forecast hospital resource requirements have become more apparent in recent years. Through sustainable use of modelling, the allocation
of resources can be significantly improved so that the number of bed crises could be reduced to a minimum, or even avoided completely [3].
In recent years, the volume of satellite imagery has also grown significantly, as more satellites were placed in orbit to monitor the status of the Earth. As a result, this brings a diverse number of
applications with which satellite data can be attributed towards in the field of research. With that in mind, several projects such as this one have become even more practical to undertake, designed with the sole intention to tackle and solve issues in the real world. Thus, the availability of this expanding satellite data presents a great opportunity for discovering novel approaches, specifically data-driven methodologies. Indeed, the Sentinel-3 Earth observation satellite developed by the European Space Agency as part of the Copernicus Programme, was used to capture the land surface temperature data for the purpose of this project.
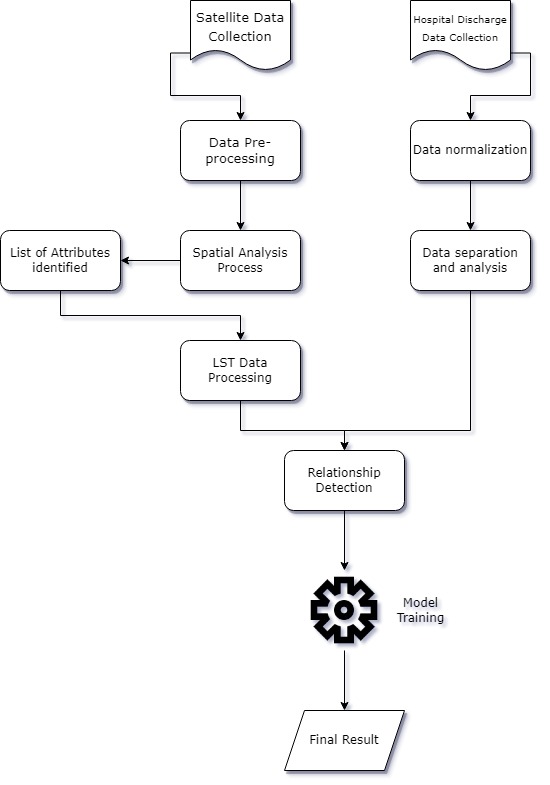
The work behind this research study attempts to solve such issues by closely identifying a tentative relationship between fluctuations in land surface temperature in conjunction with hospital discharge data. The aforementioned data covers anonymous information including the
admission and discharge data as well as the admitting ward and discharging ward of every patient from a specific period of time. Land Surface Temperature (LST) data was obtained from a day-to-day basis spanning one whole year. Moreover, an inset figure was drawn on each individual LST data frame to solely cover the geographical region that surrounds the Maltese borders. This was done to obtain the best accuracy possible when attempting to compare the two datasets simultaneously. Moreover, these satellite images were compared and changes in temperature were recorded from time to time.
Ultimately, the results obtained could be deemed useful for health professionals, policymakers that may seek the impact of movements in temperature concerning hospital admission figures.
References/Bibliography:
[1] “Active ageing : a policy framework”, World Health Organization, 2002. [Online]. Available: https://apps.who.int/iris/handle/10665/67215.
[2] “A Disease-based Comparison of Health Systems – What is Best and at What Cost?”, OECD Publications, France, 2003. [Online]. Available: https://www.oecd-ilibrary.org/social-issues-migration-health/a-disease-based-comparison-of-health-systems_9789264100053-en.
[3] M. Mackay and M. Lee, “Choice of Models for the Analysis and Forecasting of Hospital Beds”, Health Care Management Science, vol. 8, no. 3, pp. 221-230, 2005. Available: 10.1007/s10729-005-2013-y.
Student: Bernard Cassar
Course: B.Sc. IT (Hons.) Computing and Business
Supervisor: Dr Lalit Garg