The World Health Organisation estimates that as a result of road traffic accidents, the lives of about 1.35 million people are ended each year [1]. Traffic accidents lead to loss of life and property; therefore, it is imperative to understand road data to provide safe traffic movements to the road users and ensure their safety [2].
The main objective of this study is to contribute towards creating safer roads by generating awareness amongst drivers of the risk of using particular routes. It is difficult to stop road accidents from occurring especially with the increase in vehicles on the road that we have seen in recent years. However, it is not impossible to reduce the impact of road accidents on drivers by extracting knowledge and patterns from reported data and informing drivers of potential risks.
This research project presents a probabilistic approach on how to measure and determine the risk of dangerous roadways. Data on road accidents from 2015 to 2019 from two separate data sources, the police and local wardens, was obtained and cleaned, processed and investigated to create a clear picture of the unsafe and hazardous roads in Malta. This work presents a methodology for identifying crash hotspots in terms of injury cost, and identifying high-risk locations by using the frequency of reported accidents. Every road that had any collision from was assigned a ‘risk factor’ from one to five: the higher the factor, the greater the amount of reported accidents in that particular road. On the other hand, every road where an accident that involved one or more injuries was reported was given a colour; either amber, red or black depending on the number of people injured when compared to those not injured in accidents in that road. Those roads labelled as an amber have a low probability of injury cost and loss when compared to the red and black roads, that are progressively worse. An interactive map was built so that drivers can identify risky and hazardous roads when planning their driving trip or during their travel by car. The driver chooses
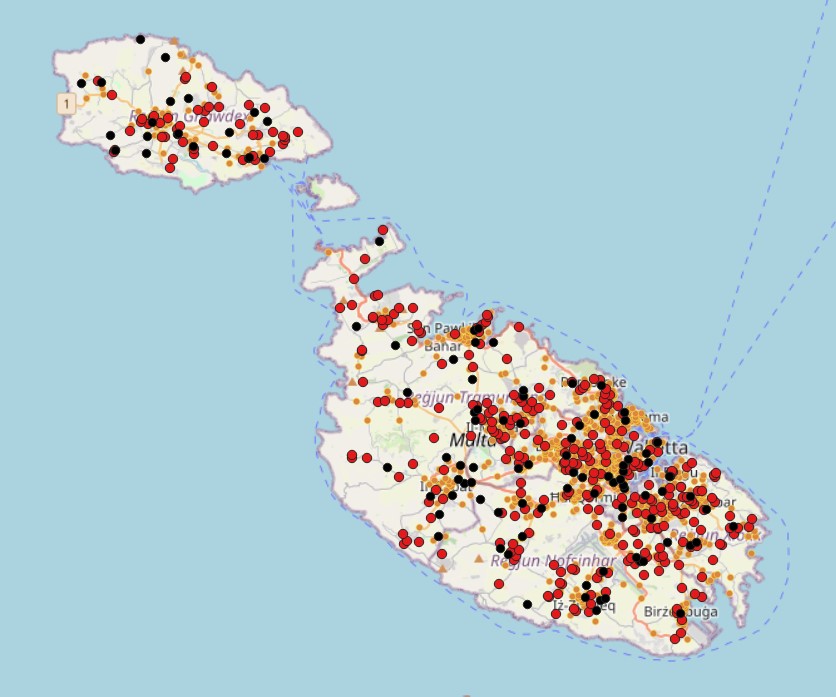
the time of day (Morning, Afternoon or Evening), during which s/he intends to perform the journey and inputs the start and destination points of the trip. The route between the two points will be colour coded, depending on the risk factor of that road at that chosen time of the journey. If the route passes through injury-prone roads, these are marked on the map.
The research findings are visualised on an interactive map, and the resultant probabilities show that Malta has on average more frequent collisions than Gozo. However, when taking injuries into consideration, Gozo has a higher number of percentages of red and black injury roads than Malta. Additionally, the roads that have the highest number of reported accidents, are not the most dangerous in terms of the injuries sustained during impact. Furthermore, it could be concluded that the roads with the highest number of accidents experience heavy traffic.
Therefore, traffic congestion leads to more accidents although, drivers are not usually injured.
References/Bibliography:
[1] World Health Organisation, Global status report on road safety: time for action, Geneva: www.who.int/violence_injury_prevention/ road_safety_status/2009, 2009.
[2] F.Malik, S. Jabber and I.Rashid, “Road Accidents and Prevention,” International journal of egineering development and research, no. 5, pp. 40-46, 2017.
Student: Miriana Buhagiar
Course: B.Sc. IT (Hons.) Computing and Business
Supervisor: Dr. Peter Albert Xuereb
Co-supervisor: Mr. Joseph Bonello