In Industry 4.0, the user is overwhelmed with all the information that is generated from the machines. This creates a problem, as informative irregular errors could get lost in the sea of data. Hence, virtual interfaces- responsive & adaptive (VI-RA) was designed employing anomaly detection to identify these abnormal entries within a multitude of data. VI-RA could then visualise data for each zone on site to the user through an augmented reality (AR) application, allowing for interaction with the display to reveal information about the errors.
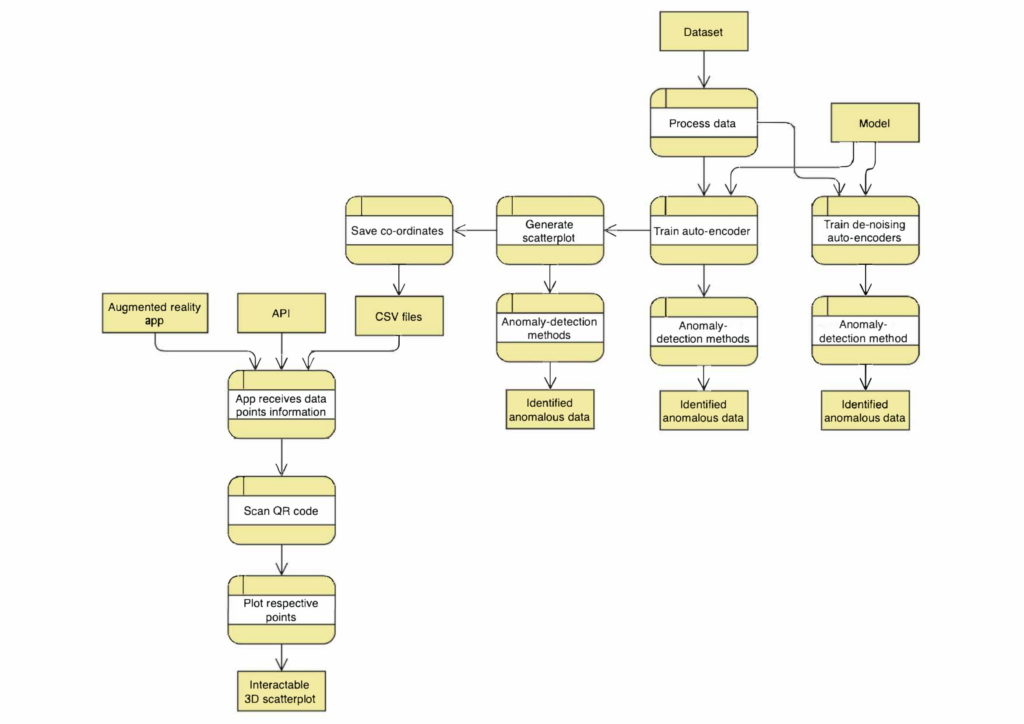
VI-RA makes use of three main methods for the identification of anomalous data. The first method makes use of an auto-encoder that identifies an anomalous field by passing data through a trained model and indicating which entries return the largest error. The second method uses a de-noising auto-encoder to reconstruct missing fields within the dataset. This allows for a comparison between an expected and generated output towards singling out the anomalous field. The final function generates a scatter plot from the auto-encoder’s thought vector so as to produce a visual representation of the dataset. The distance between the generated data points is then used to identify anomalous fields. Although this method managed to generate the desired results in this study, it proved to be the least consistent among the three. This was more evident as the complexity of the anomalies within the dataset increased. On the other hand, the auto-encoder and de-noising auto-encoder could return the desired anomalous entries with better frequency, thus proving to be the more promising methods for anomaly detection.
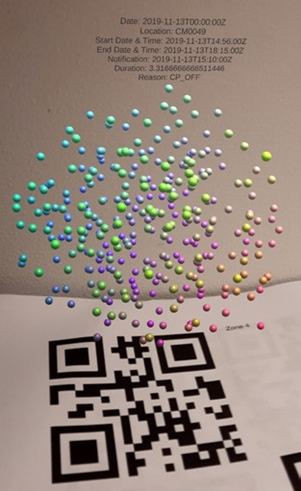
An AR application was used to allow the user better visualisation and interaction with certain achieved results. The scatterplot co-ordinates for each zone within the dataset are sent over an API and received by the application, which displays a three-dimensional plot over a respective QR code for each zone. The points reveal information about their relative-error occurrence when interacted with, allowing for outliers to be easily identified, and the cause of their occurrence to be immediately evaluated.
Student: Giulia Elena Caligari
Course: B.Sc. IT (Hons.) Artificial Intelligence
Supervisor: Dr. Vanessa Camilleri