Reliable monitoring of urban growth is needed for responsible decision-making, as the world faces a significant increase in population to the detriment of the surrounding environment. Different approaches could be taken to collect this data. Earth observation (EO) data provides a viable option given its wide coverage, revisit frequency and spatial resolution.
A family of EO satellites called the Sentinels was launched at different stages as part of the Copernicus Program, which was initiated by the European Union. This new generation of remote sensing satellites has enhanced the observation, identification, mapping, and monitoring of urban areas. Therefore, the Sentinel satellites are a very efficient option for monitoring urban growth in a specific area.
The study area of this project covered rural areas in Malta. In this project, a labelled dataset was developed to delineate the border between urban areas, such as industrial areas and residential buildings, and rural areas such as agricultural land and woodland. Different segmentation techniques were used to distinguish between these two types of land cover.
Segmentation is a process that assigns a class label to each pixel in each image. Segmentation techniques tend to be divided into classical methods and those based on machine learning (ML). This final-year project focused on extracting features from the image to train ML models for the task of segmentation. Image features are an essential component of image segmentation because they provide information about the visual characteristics of the image. These features could be based on colour, texture, shape, intensity, or other visual attributes. Features such as RGB colour values, HSV, grayscale and homogeneity were extracted from the Sentinel images. Furthermore, segmentation algorithms such as SLIC (simple linear iterative clustering) and Watershed were used to segment the satellite images using certain features mentioned. The accompanying image portrays the result obtained through the Watershed algorithm.
From the collected data, it was possible to use ML to compute the accuracy score for certain features extracted – such as logistic regression (LR). This is an ML algorithm that could help predict the probability of an event happening based on some input features. In one case in this project, data such as the mean RGB was used to train an LR model. The model was evaluated and acquired an accuracy of 0.67, meaning that it correctly predicted 67% of the test data. In this case, the LR model was trained to classify whether an annotation in an image was ’urban’ or ‘rural’ based on the mean RGB values of the pixels in the annotation.
Another accuracy score was calculated from the homogeneity feature by using a multi-layer perceptron classifier, which is a type of artificial neural network used for classification. This test resulted in a much better score of 93%, thus offering a better result over RGB features.
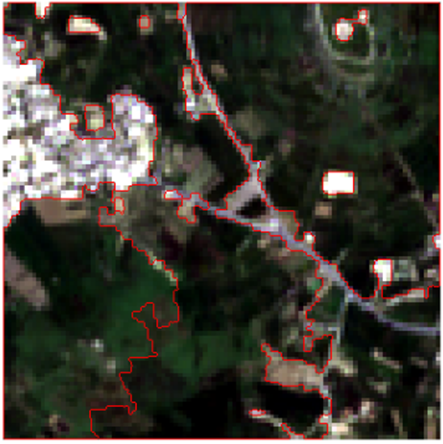
Figure 1. A sample result obtained through Watershed segmentation
Student: Mikhail Magri
Supervisor : Dr Ing. Gianluca Valentino