The knowledge held by a company’s employees is a mission-critical asset in software engineering organisations. It is the creation, transfer and application of such organisational knowledge that provides such companies with the competitive edge required to provide value to their customers. This asset is hard to manage and maintain due to high labour turnover rates and hence, these companies need to find a way to protect it.
The software engineering community is familiar with the so-called Truck Factor metric which is defined as the minimal number of developers that have to be hit by a truck or leave before the project becomes in trouble. Of course, the notion of being hit by a truck is an extreme one, but more realistic threats such as people leaving the company will have similar repercussions. Alternatively, this metric reveals the project’s concentration of knowledge and its key developers.
Many algorithms have been proposed to calculate this metric by extracting maintenance activity data from version control systems such as Git. Despite popular understanding of the metric’s notions, there are still challenges with its calculation and interpretation. Therefore, in this research study, an implementation of an existing technique to calculate this analysis together with improvements and different thresholds, is proposed. These improvements consider the recency of work done by developers, as well as considering line-level edits (as opposed to file-level) when calculating the Truck Factor for a project.
To explore the validity of the different ways in which the Truck Factor can be calculated, we worked with an industry partner who provided us with access to a git repository. This repository was analysed using the three different calculation methods, each time drawing conclusions regarding possible knowledge risks for that project. These conclusions were then presented to the industry partner for feedback on their perceived validity.
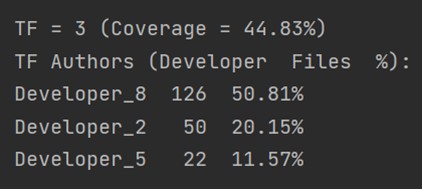
number of key developers found, together with their respective
developer names, number of authored files and total percentage of
files
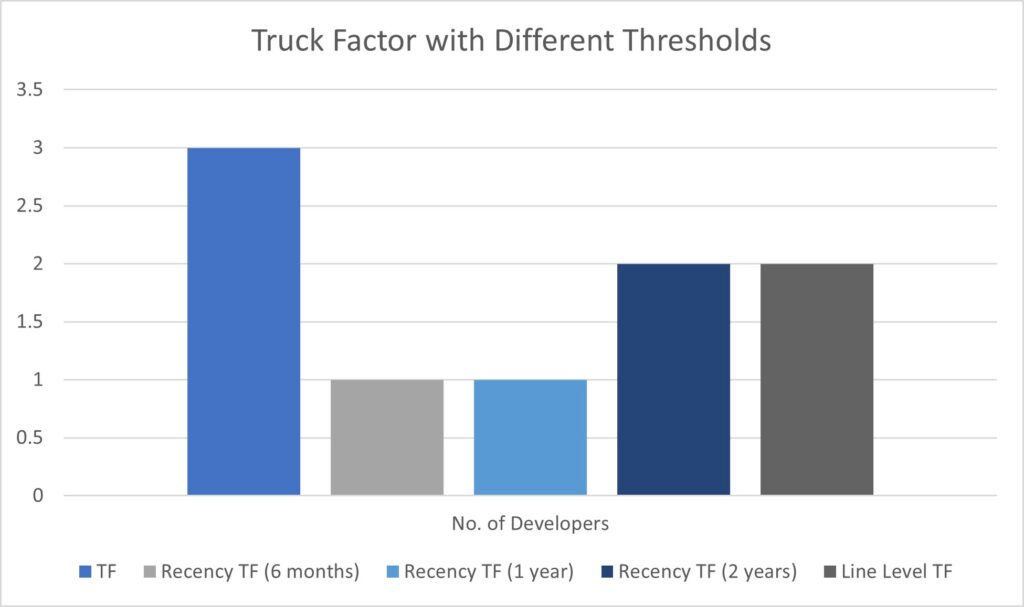
different calculation methods adopted
Student: Jolene Sultana
Course: B.Sc. (Hons.) Computing Science
Supervisor: Dr Mark Micallef