It is in the interest of businesses, regardless of scale, to gather and collect data relevant to their operation. This data could concern its customers, suppliers, employees, transactions, industry, and so on. It could be very useful for businesses and their decisions, but only if interpreted and used in a productive manner. Hence, the need to analyse data adequately is vital, which is why businesses should use their data to capture and create value from it ‒ in other words, organise this data, visualise it and analyse it in a way that would make it simpler to act on.
This project set out to help a local business gain insight into the data that it has in its possession, more specifically its enterprise resource planning (ERP) data, by using business intelligence (BI). Acquiring the needed datasets for the BI dashboards involved gathering and collecting relevant datasets from the ERP system of the business in question. This data was then transformed and cleansed to ensure that it would be consistent and complete, and in the right format. Once this was done, the transformed data was loaded into Microsoft Power BI, a very popular BI tool. Based on the input of management and other staff, dashboards were then created for each department of the business, including the visualisation of key performance indicators (KPIs) and other metrics. These dashboards and reports were then analysed to determine the potential value of using such technologies in this context. The insights provided by the dashboards enabled certain decisions to be taken, such as those involving new business initiatives, and their performance was evaluated using the live data in the form of KPIs.
Visuals forecasting future sales were also implemented in some dashboards, helping the businesses make more informed decisions, improve operational efficiency and increase profitability. Moreover, a supervised machine learning model was built using Python to help recreate the model that Microsoft Power BI uses to obtain its forecast conclusions. Figure 1 presents a screenshot of one of the dashboards implemented in Microsoft Power BI, covering all the crucial information required by that department, using different types of charts, KPIs and forecasting tools.
The created dashboards and models were then submitted for evaluation. Various employees/stakeholders from each department within the business were consulted before and after the creation of aforementioned dashboards. The visuals/dashboards were built based on user input, and the same users participated in the evaluation process to offer feedback and rate the usefulness, effectiveness and usability of the proposed software.
The dashboards and models were deemed to be very useful. They were considered very relevant in enhancing a company’s decision-making process, and providing the company CEO with a wider picture (in terms of performance) on each of the departments within the company.
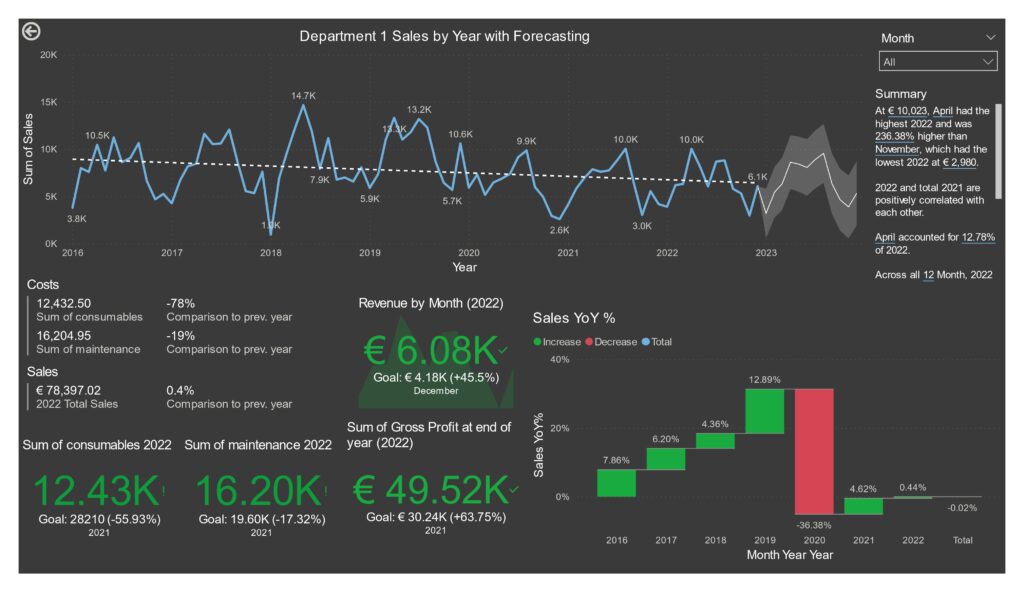
Figure 1. Business intelligence dashboard for a sample department
Student: Isaac Cutajar
Supervisor : Dr Peter A. Xuereb